


この記事で分かること
- pythonで「動径方向の平均プロファイル」を実装したい人に向けた記事です。
- 平均を計算して滑らかなプロファイルを計算します。
- コードだけ載せます。
目次
コード
import numpy as np
import matplotlib.pyplot as plt

# 関数定義
def mean_radial_profile(arr, center, r_max):
    y, x = np.indices((arr.shape))
    r = np.sqrt((x -center[0])**2+ (y -center[1])**2)

    mean_1D = []
    for i in range (r_max):
        w = 1 -np.abs(r -i)
        ww, dd= w[0<=w], arr[0<=w]
        mean_1D.append(np.sum(dd*ww)/np.sum(ww))

    mean_2D = np. zeros_like(r)
    for i in range(r_max):
        w = 1 -np.abs(r -i)
        mean_2D += np.where(0<=w, mean_1D[i] *w, 0)

    return mean_1D,mean_2D

# デモデータ
s0,s1 = 30,30
arr = np.random.rand(s0,s1)
mean_1D,mean_2D = mean_radial_profile(arr, (s0/2,s1/2), 150)

# 表示
fig = plt.figure( tight_layout=True)
ax1 = plt.subplot(212)
ax1.margins(0.05)
ax1.plot(mean_1D)
ax1.set_title('mean profile')

ax2 = plt.subplot(221)
ax2.margins(2, 2)
ax2.imshow(arr)
ax2.set_title('original img')

ax3 = plt.subplot(222)
ax3.margins(x=0, y=-0.25)
ax3.imshow(mean_2D)
ax3.set_title('mean img')

plt.show()
使い方
距離の少数点以下を平均で計算することで、滑らかな動径方向のプロファイルを求めます。
mean_1D,mean_2D = mean_radial_profile(arr, (s0/2,s1/2), 150)引数1・・・平均プロファイルを求める2D array
引数2・・・中心点の座標をリストで渡します。特に無ければ2D arrayのサイズの半分に。
引数3・・・どの大きさまで計算するか決めます。2D arrayのサイズより適当に大きい値を指定してもよいです。
返り値は、1Dと2Dの平均を返します。
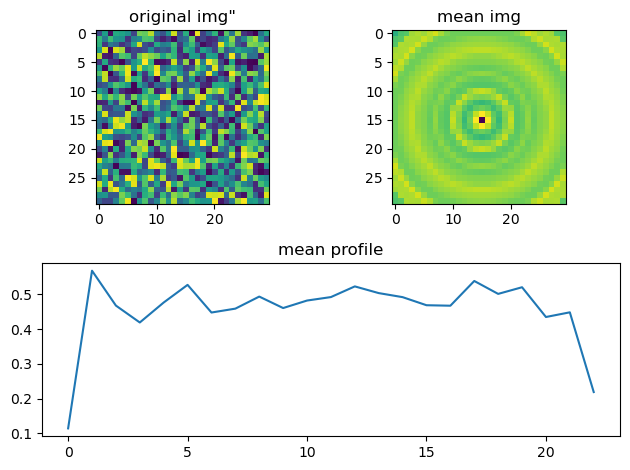
下記画像のとおりmean_1Dは平均動径プロファイルで、mean_2Dはmean_1Dをぐるっと一周広げたものです。


コメント