この記事で分かること
- pythonのmatplotlibでGUIでフィッティングをしたい人向けの記事です。
- (1) はじめにバックグラウンドをフィッティング
- (2) さらに残差を複数のガウシアンでフィッティング
- という解析ステップのより実践的なスクリプトを紹介します。
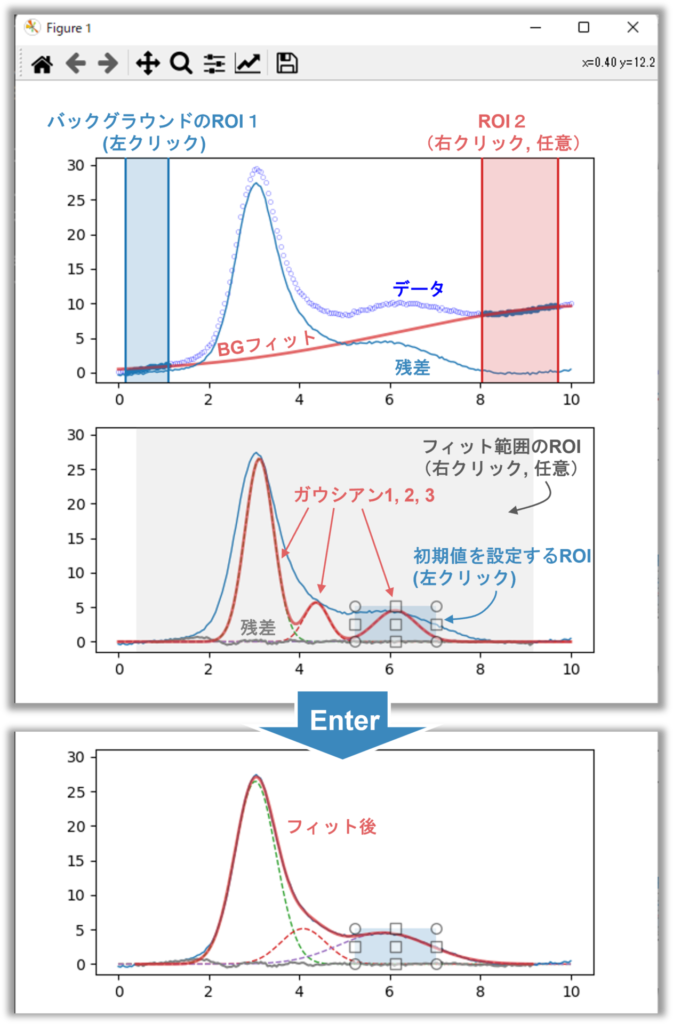
以前matplotlibを用いたGUIの記事を作成しましたが、今回はより実践的なスクリプトを作成しました。
バックグラウンドと残りの成分のフィッティングを分け、2段階で解析を行います。
あわせて読みたい


Matplotlib | GUIで範囲選択してフィッティング
この記事で分かること Matplotlibを用いてGUI上でフィッティングを実施。 選択範囲を選ぶと結果をリアルタイムにプロットできます。 意外とweb上に見当たらなかったので…
目次
コード
# ax1のsubplotsで先にバックグラウンドを引いて
# ax2のsubplotsで残差にさらにフィッティングする。

import numpy as np
import pandas as pd
import matplotlib.pyplot as plt
from matplotlib.widgets import SpanSelector, RectangleSelector
from lmfit.models import PseudoVoigtModel, GaussianModel
from lmfit.lineshapes import gaussian

class Fit:
    def __init__(self, axes, df):
        self.ax1,self.ax2 = axes or plt.gca()
        self.df = df
        # デフォルトのモデルは1
        self.key_input = "1"
        self.key_input_previous = "1"
        # キー入力1~9をモデルに使う
        self.cmps = [str(i+1) for i in range(9)] # as strings
        # ax1のフィット範囲
        self.list_ROI1 = [0,0,0,0]
        # ax2のモデル[model],[params],[ROI] # ax2のフィット範囲のデフォは全範囲
        self.dict_model21 = {"ROI":[self.df.x.min(),self.df.x.max()]}
        # ax2のモデル要素の情報[num][model],[num][params],[num][ROI],[num][prefix]
        self.dict_model22 = {}
    #---------------------------------------------------------
    # ax1のフィット
    def fit1(self):
        # フィット範囲を抽出したdf
        x0,x1,x2,x3 = self.list_ROI1
        df01, df23 = df.query(f'{x0}<x<{x1}'), df.query(f'{x2}<x<{x3}')
        df2 = pd.concat([df01, df23])

        model1 = PseudoVoigtModel()
        params1 = model1.guess(df.y, x=df.x)
        result = model1.fit(df2.y, params1, x=df2.x)

        fit1 = model1.eval(result.params, x=df.x)
        self.df["fit1"] = fit1
        df["residual1"] = df.y -fit1

        # フィット、ROI、残差をプロット
        plot_fit1_ax1.set_data(df.x,  fit1)
        plot_ROI1_ax1.set_data( df01.x, df01.y)
        plot_ROI2_ax1.set_data( df23.x, df23.y)
        plot_residual1_ax1.set_data(df.x, df["residual1"])
        plot_residual1_ax2.set_data(df.x, df["residual1"])

        fig.canvas.draw()
        fig.canvas.flush_events()

    # ax1のフィット範囲1
    def select_callback11(self, x0, x1):
        # 左クリック
        self.list_ROI1[0],self.list_ROI1[1] = x0,x1
        self.fit1()

    # ax1のフィット範囲2
    def select_callback12(self, x0, x1):
        # 右クリック
        self.list_ROI1[2],self.list_ROI1[3] = x0,x1
        self.fit1()
    #---------------------------------------------------------

    #---------------------------------------------------------
    # ax2のフィット
    def fit2(self):
        x0,x1 = self.dict_model21["ROI"]
        model, params = self.dict_model21["model"], self.dict_model21["params"]
        df2 = self.df.query(f'{x0}<x<{x1}')

        result = model.fit(df2["residual1"], params, x=df2.x)
        print(result.fit_report())

        fit2 = model.eval(result.params, x=self.df.x)
        fit2_ROI = model.eval(result.params, x=df2.x)

        # フィットと残差をプロット
        plot_fit2_ax2.set_data(df2.x,fit2_ROI )
        plot_residual2_ax2.set_data(df2.x, df2["residual1"] -fit2_ROI)

        # 各要素をプロット
        comps = result.eval_components(x = self.df.x)
        for key in list(self.dict_model22.keys()):
            plot_fit2_c1_ax2[key][0].set_data(self.df.x, comps[f"c{key}_"]) # [0] is necessary

        fig.canvas.draw()
        fig.canvas.flush_events()

    # ガウシアンモデル作成
    def prep_gauss(self,i, x0,x1,y0,y1 ):
        xmin,ymin = [min(x0, x1), min(y0, y1)]
        xmax,ymax = [max(x0, x1), max(y0, y1)]
        print(xmin,xmax,ymin,ymax)
        gauss = GaussianModel(prefix=f'c{i}_')
        params = gauss.make_params(
                center = xmin +(xmax-xmin)/2,
                sigma = (xmax -xmin)/4,
                amplitude = (ymax -ymin)
            )
        return gauss,params

    # ax2のモデルを用意&プロット
    def select_callback21(self, eclick, erelease):
        x0, y0 = eclick.xdata, eclick.ydata
        x1, y1 = erelease.xdata, erelease.ydata

        if self.key_input in self.cmps:
            gauss,params = self.prep_gauss(self.key_input, x0,x1,y0,y1)
            self.dict_model22.update({
                self.key_input:{
                    "ROI":[x0,x1],
                    "prefix":f"c{self.key_input}_",
                    "model":gauss,
                    "params":params}
                })
        print(list(self.dict_model22.keys()))

        model,params = self.dict_model22["1"]["model"], self.dict_model22["1"]["params"]
        for key in list(self.dict_model22.keys()):
            if key != "1":
                model += self.dict_model22[key]["model"]
                params.update(self.dict_model22[key]["params"])

        self.dict_model21.update({
            "model":model,
            "params":params
            })

        # モデルの和をプロット
        plot_fit2_ax2.set_data(self.df.x,model.eval(params, x=self.df.x))

        # 各モデルをプロット
        for key in list(self.dict_model22.keys()):
            plot_fit2_c1_ax2[key][0].set_data(self.df.x, self.dict_model22[key]["model"].eval(self.dict_model22[key]["params"], x=self.df.x)) # [0] is necessary

    # ax2のフィット範囲
    def select_callback22(self, x0, x1):
        self.dict_model21.update({"ROI":[x0,x1]})
        self.fit2()
    #---------------------------------------------------------

    # キーボード入力を受ける
    def key_press(self,event):
        self.key_input_previous = self.key_input
        self.key_input = event.key
        print(event.key)
        print(list(self.dict_model22.keys())) # fit2に含まれるモデル

        # 1~9: モデルiの削除
        if event.key in [f'ctrl+{i}' for i in list(self.dict_model22.keys())]:
            i = event.key.replace("ctrl+","")
            self.dict_model22.pop(i)
            plot_fit2_ax2.set_data([],[])
            plot_fit2_c1_ax2[i][0].set_data([],[])
            plot_residual2_ax2.set_data([],[])
            fig.canvas.draw()
            fig.canvas.flush_events()
            print(f'del {i}')

        # Enter: ax2のfit
        if(event.key=="enter"):
            self.fit2()
            # key_inputwを戻した方が便利
            self.key_input = self.key_input_previous


#デモデータ
x = np.linspace(0, 10.0, 201)
data = x + gaussian(x, 20, 3.0, .4) \
    + gaussian(x, 15, 3.5, .75) \
    + gaussian(x, 10, 6.0, 1.0) \
    + np.random.normal(scale=0.1, size=x.size)
df = pd.DataFrame(np.array([x,data]).T,columns=["x","y"])

fig, (ax1,ax2) = plt.subplots(2, figsize=(6,6))
fit = Fit((ax1,ax2), df)
fig.canvas.mpl_connect('key_press_event', fit.key_press)

ax1.plot(df.x, df.y, ".", mfc='none', mec ="b", mew= 0.2 )
plot_ROI1_ax1, = ax1.plot([],[], c="tab:blue", marker= ".")
plot_ROI2_ax1, = ax1.plot([],[], c="tab:blue", marker=".")
# フィット1
plot_fit1_ax1, = ax1.plot([],[], c="tab:red", alpha=0.7, lw=2)
# フィット残差1
plot_residual1_ax1, = ax1.plot([], [], c="tab:blue", lw=1)

ax2.plot(df.x, df.y, alpha=0)
# フィット2要素
plot_fit2_c1_ax2 = {str(i):ax2.plot([],[],"--", lw=1) for i in range(10)}
# フィット残差1
plot_residual1_ax2, = ax2.plot([], [], c="tab:blue", lw=1)
# フィット残差2
plot_residual2_ax2, = ax2.plot([], [], c="gray")
# フィット2
plot_fit2_ax2, = ax2.plot([],[], c="tab:red", alpha=0.7, lw=2)

# ax1のフィット範囲1。左クリック
SS1 = SpanSelector(
    ax1, fit.select_callback11,
    "horizontal", button=[1],
    useblit=True, props=dict(alpha=0.2, facecolor="tab:blue"),
    interactive=True, drag_from_anywhere=True)

# ax1のフィット範囲2。右クリック
SS2 = SpanSelector(
    ax1, fit.select_callback12,
    "horizontal", button=[3],
    useblit=True, props=dict(alpha=0.2, facecolor="tab:red"),
    interactive=True, drag_from_anywhere=True)

# ax2のモデル作成。左クリック
RS1 = RectangleSelector(
    ax2, fit.select_callback21, button=[1],
    interactive=True, props=dict(alpha=0.2, facecolor="tab:blue"))

# ax2のフィット範囲1。右クリック
SS3 = SpanSelector(
    ax2, fit.select_callback22,
    "horizontal", button=[3],
    useblit=True, props=dict(alpha=0.1, facecolor="tab:grey"),
     drag_from_anywhere=True)

plt.show()
今回は長いですね。
使用方法
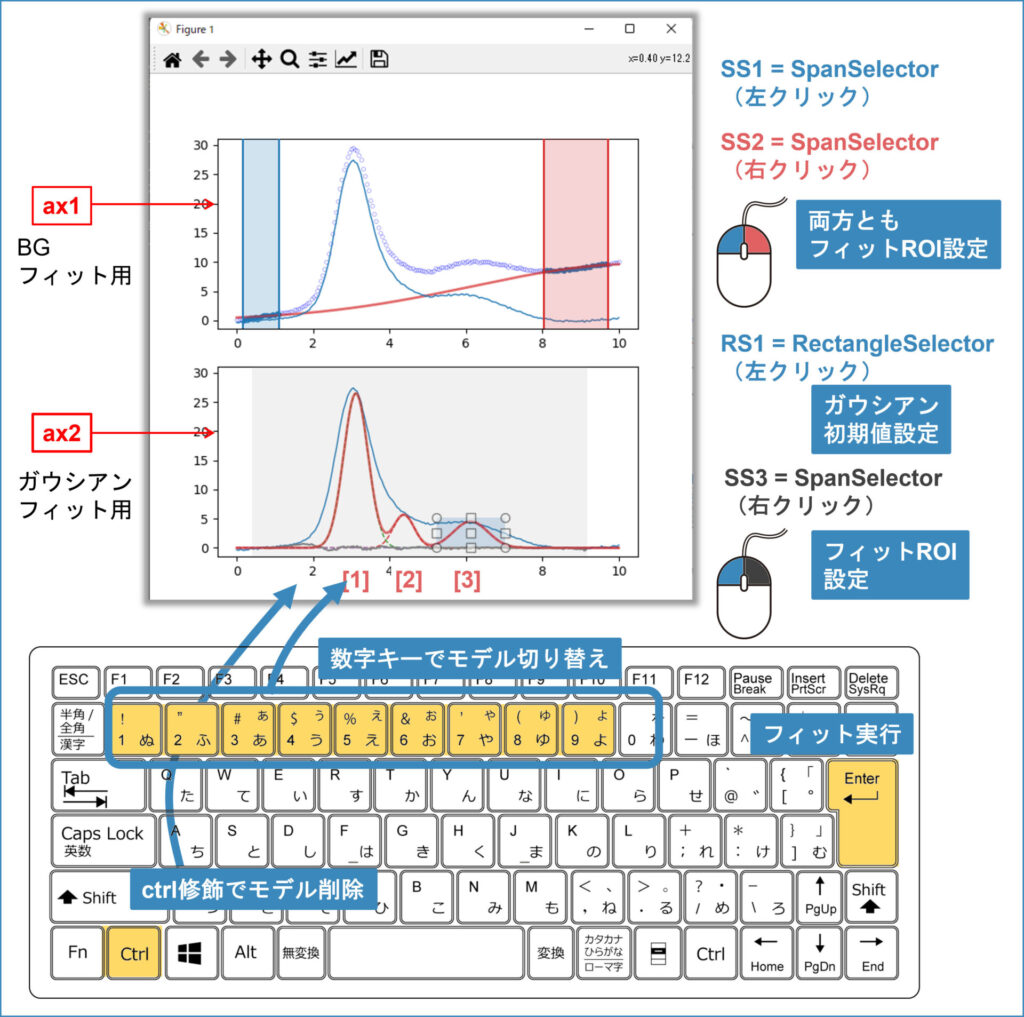
STEP
上段のプロット: ax1
ax1はデータにバックグラウンド(BG)をフィットします。
- 左クリックでSS1を設定でき、BGのフィット範囲(ROI)を決めます。
- 右クリックでSS2を設定でき、BGフィットを2つのROIで行えます。
- 残差が青線で表示されます。
STEP
下段のプロット: ax2
ax2はもax1に表示されるプロット残差が表示されます。
- 左クリックでRS1を描いて初期値を与えたガウシアンを設定できます。
- キーボードで1から9を押すとガウシアンを追加できます。画像では2,3を押して計3つのガウシアンを設定しています。
ctrl+1~9で作成した該当のモデルを消去できます。
STEP
フィット実行
- Enterを押すとフィットを実行します。初期値ではプロット全体をフィットします。
- ax2を右クリックでフィット範囲を決めるSS3を設定できます。SS3を設定後フィットを実行します。
ポイント解説
フィッティングとGUIの主な動作はFitクラス内で定義しています。クラスメソッドとクラス変数の概要を説明します。
- init
- self.df = df … データ
- self.key_input … 入力キー
- self.key_input_previous … 1つ前の入力キー
- self.cmps … 複数モデルを管理するkey(文字1~9)のリスト
- self.list_ROI1 … ax1のROI1とROI2を記録
- self.dict_model21 … ax2の全モデル
- self.dict_model22 … ax2の個別のモデル
- fit1
- ax1のフィット実行
- select_callback11
- SS1のコールバック関数 ax1のROI1
- select_callback12
- SS2のコールバック関数 ax1のROI2
- fit2
- ax2のフィット実行
- prep_gauss
- ガウシアンモデルの作成
- select_callback21
- RS1のコールバック関数 ax2のモデルを準備、プロット
- select_callback22
- SS3のコールバック関数 ax2のフィットROI
- key_press
- キー入力の記憶および入力に応じて実行
- Enter: ax2のフィット実行(fit2)
- ctrl + 1~9: 記憶した番号のモデルを削除
- キー入力の記憶および入力に応じて実行
続きます
今回長くなったので、コードのポイントの解説は記事を分けます。
あわせて読みたい


Matplotlib | GUIでバックグラウンド処理後に複数のガウシアンフィッティング(2)
この記事で分かること pythonのmatplotlibでGUIでフィッティングをしたい人向けの記事です。 (1) はじめにバックグラウンドをフィッティング (2) さらに残差を複数のガ…
まとめ
matplotlibでGUIフィットを行うスクリプトを紹介しました。














コメント